IS Families/IS110 family-new
Contents
- 1 Historical
- 2 Two IS110 family subgroups and relation to the Piv and MooV invertases
- 3 Organization
- 3.1 IS110 and IS1111 Subgroups Based on Transposase Sequences
- 3.2 Length Distribution.
- 3.3 Direct Target Repeats, DR and the Problem of Defining the Ends
- 3.4 Subterminal inverted repeats.
- 3.5 Non Coding Region (NCR).
- 3.6 Transposase Coding Sequence.
- 3.7 Predicted Transposase Structures of IS110 and IS1111 group Members show Identical Domain Structures
- 4 Transposase activity
- 5 Mechanism
- 5.1 IS110 family members generate circular double strand DNA intermediates.
- 5.2 Circle formation and integration of the IS110 group: ISEc21
- 5.3 Circle formation and integration of the IS110 group: ISPpu9.
- 5.4 Circle Excision and Insertion Specificity of Additional IS110 and IS1111 Group IS.
- 5.5 Transposon Circles and insertion specificity: IS1111 group
- 5.6 Insertion specificity and target secondary structures
- 5.7 Extensive Bionformatic Analysis of Target Sequences
- 5.8 Transposase expression
- 6 RNA from the NCR may be Involved with Target choice and Integration
- 6.1 NCR RNA from IS110 group members:IS621
- 6.1.1 Identification of Specific NCR from IS621 (IS1111) with Strong Transposase Affinity
- 6.1.2 A Consensus ncRNA Double Loop Structure for IS621 Orthologues
- 6.1.3 Extending the Consensus to Other Group Members: ncRNA Complementarity with Donor Junction and with Target
- 6.1.4 An Invasion Model for Bridging Donor and Target Sequences
- 6.1.5 An Efficient in vitro Recombination Reaction: ncRNA Functions to Bridge Donor and Target.
- 6.1.6 Testing the Model: an in vivo Plasmid-Based Integration System.
- 6.1.7 Reprogramming Bridge RNA
- 6.1.8 Flexibility in IS621 Target Specificity.
- 6.1.9 Insertion in vivo: Reprograming the Target site.
- 6.1.10 Reprograming the Donor site
- 6.1.11 Insertion in vivo: Reprograming the Donor site
- 6.2 NCR RNA from IS110 Group Members: ISEc21.
- 6.3 Exploring Bridge RNA Secondary Structures from Other IS110 Family Members
- 6.4 RNA from IS1111 Group Members.
- 6.1 NCR RNA from IS110 group members:IS621
- 7 Use in Genome Modification
- 8 Structural Analysis: the Synaptic Complex Involved in IS621 Circle Integration
- 9 Questions to be Answered
- 10 Acknowledgements
- 11 Bibliography
Historical
IS110 was originally identified in 1985 in Streptomyces coelicolor A3(2) as an element present in a derivative of bacteriophage phiC31 carrying a selectable viomycin resistance gene. The phage was deleted for its attachment site and therefore unable to lysogenise its host. The presence of IS110 enabled the phage to integrate using homologous recombination with resident IS110 copies in the chromosome [1].
There are over 350 examples of IS110 family members from nearly 130 bacterial and archaeal species in the ISfinder database (May 2025) [2]. However,the Tpases of a very large number have also been identified in various sequenced bacterial genomes. Since the ends of most of these elements have not been defined they are not included in ISfinder.
Members such as the Mycobacterium paratuberculosis-specific IS900 and IS901 and the Coxiella burnetti IS1111 [3] are important because they can be used as a highly specific marker for precise strain identification (e.g. [4][5][6][7][8][9][10][11][12][13]). One of the earliest studied IS110 group members was IS492, from Pseudomonas atalantica originally identified by its activity in extracellular polysaccharide production (eps): inactivating the gene by insertion and reactivating it by excision [14][15].
Two IS110 family subgroups and relation to the Piv and MooV invertases
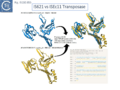
The family includes two subgroups which, it has been suggested, may represent two distinct families [16][17]: IS110 and IS1111. Members of the IS1111 sub-group are distinguished from those of the IS110 group principally by the presence of small (7 to 17 bp) sub-terminal IRs (Fig.IS110.1) and, recognized more recently, the location of relatively long non-coding regions.

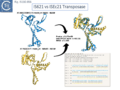
Both subgroups encode a DEDD transposase and, at present is the only IS family known to encode this type of enzyme. DEDD transposases (see: Groups with DEDD Transposases) are related to the RuvC Holliday junction resolvase [22]. The Tpase was observed to be closely related to the Piv and MooV invertases from Moraxella lacunata / M. bovis [23][24] and Neisseria gonorrhoeae [25][26][27] (Fig.IS110.2).
Piv catalyses inversion of a DNA segment permitting expression of a type IV pilin. Intriguingly, early studies revealed that the transposase of one IS, IS621, clustered within the Piv clade (Fig.IS110.2 A) and the IS carries ends with similarities to those of the 26 bp pilin gene inversion sequences [25] (Fig.IS110.2 B). Several piv-like genes (irg1-8 for invertase-related gene) were identified in Neisseria gonorrhoeae strain FA1090 [27]. However, none could complement either the Moraxella lacunata Piv or the IS492 transposase and inactivation of all eight genes and overexpression of one copy of each failed to show an effect on pilin variation, DNA transformation or repair.
Furthermore, analyses of DNA flanking the coding sequences supported the hypothesis that the Piv homologues are indeed transposases for two new IS110 family members, ISNgo2 and ISNgo3. ISNgo2 (irg3, 4, 5, 6 and 8) is present in multiple copies in N. gonorrhoeae while ISNgo3 (irg7 and also closely related to pivNM1) is found in single copy in N. gonorrhoeae and in duplicate copies in Neisseria meningitidis [27]. However, neither has yet been formally shown to transpose.
"Care should therefore be exercised in distinguishing between IS110 family transposases and functional piv genes."

It was pointed out that one major difference in the organization of IS110 family members and the inversion systems is that, in the piv system, the recombinase is located outside the invertible segment, while in the IS110 family, it is located within the IS element [22]. It is interesting that the piv gene is located in a cluster of IS elements in the IS110 group (Fig. IS110.2, Fig.IS110.3A and Fig.IS110.3B). It has also been pointed out that the ends of IS621, an IS closely related to piv (Fig. IS110.2) bear some resemblance to the piv recombination site [20]; Fig IS110.2 B).
Organization
IS110 and IS1111 Subgroups Based on Transposase Sequences
Although the Tpases of the IS110 and IS1111 groups are very similar, more detailed analysis of those in the ISfinder library showed that they generally separate into two distinct groups delineating the IS110 members (orange segment in the figure) from those of the IS1111 group (blue segment in the figure) (Fig.IS110.3A) and a deeply branching segment containing a mixture of both IS subgroups (green segment in the figure), an observation subsequently confirmed by Siddiquee et al., 2024 [28] using the same database. It is possible that the few IS110 elements found within the IS1111 group and the IS1111 elements within the IS110 group have been misclassified. A similar pattern was observed in a library of transposases from over 1000 family members including members of the ISfinder collection and members extracted from public databases (Fig.IS110.3B; [18][19]). The position of piv is indicated in the figure, again, close to IS621.
Clearly, in addition to the major subgroup division, IS110 and IS1111, of this family, each contains additional deep branching clusters [28] more clearly shown in the analysis of Durrant et al., [18][19]; (Fig.IS110.3B).


Length Distribution.
Members (Fig.IS110.4) vary between 1136 bp and 1558 bp, with most clustered in the 1450 bp size range. The length distribution of the IS110 group is more disperse than that of the IS1111 group. The organization of IS110 family members is quite different from that of IS with DDE transposases: they do not contain the typical terminal IRs of the DDE IS and do not generally generate flanking target DRs on insertion. This implies that their transposition occurs using a different mechanism to that of DDE IS.

Direct Target Repeats, DR and the Problem of Defining the Ends
Some family members have been reported to generate small Direct Repeats (DRs) while others do not (e.g. Gómez-García et al [32] and [20]). However, in most cases where flanking DR occur, the data can be interpreted to show that one DR copy is present in the target while the second copy belongs to the IS and is transmitted via a circular transposition intermediate suggesting that integration is sequence-targeted. The fact that identification of IS110 and IS1111 ends is problematic due to the absence of terminal inverted repeats might also confound the question of the presence or absence of DR. The most conclusive way to identify the IS ends would be to compare empty and occupied sites or to determine the DNA sequence across the junction formed by the abutted IS ends of the circular DNA intermediate (see below Transposon circles). This is rarely undertaken. In this light, it should be noted that many of the IS110 family in ISfinder may have incorrect ends and require readjustment.
Subterminal inverted repeats.
Partridge and Hall [31] observed that a number of IS1111 subgroup members carry sub-terminal inverted repeats (IRst) (Fig. IS110.5 Left ) of 11 to 13 bp. These were located at approximately 6-7 bp from the left and 3-4 bp from the right end and were quite similar. As for other IS, these sequences might be expected to be recognized and bound by the transposase. IS110 group members do not carry these long IRst. However, when Durrant et al [18][19] undertook a covariance analysis of a number of IS1111 and IS110 group members, they not only observed the long IRst in the IS1111 group but also revealed very short IRst in the IS110 group (Fig. IS110.5 Right).

Non Coding Region (NCR).
Unlike many IS families, the transposase orf does not occupy the entire IS length. Members of the IS110/IS1111 family contain a non-coding region (NCR). This was noted for ISPpu9, an example which is clustered with both IS110 and IS1111 related IS (Figs. IS110.3A and Fig. IS110.3B), to include both upstream and downstream NCR regions [32].
However, there appears to be a distinction between the IS110 and IS1111 group in this respect. For the IS110 group, the NCR is generally upstream of the tnp orf while in the IS1111 group it is located downstream [28][18][19]). A number of examples are shown in Fig.IS110.6. Although most conform to the IS110/IS1111 pattern, several such as IS621, ISRta3, ISHvo9, ISAzo22 and ISPpu9, exhibit both the upstream and downstream regions (Fig.IS110.6) although in the case of ISPpu9, the downstream NCS is due to the presence of an ISPpu9 MITE (Fig. IS110.7A).

NCR, ISPpu9 and MITEs: a warning
The copy of the IS110 group, ISPpu9, which was originally included in ISfinder appeared to have NCR both upstream and downstream of the transposase gene. However, more detailed analysis revealed that the downstream NCR results largely from an extension which appears to be a diverged defective ISPpu9 copy. It is not clear how frequent this type of structure may be or whether it occurs at all with other family members but should be kept in mind when undertaking large scale genomic analyses.
One of these downstream NCR regions observed in the IS110 group member, ISPpu9, results largely from an extension which appears to be a diverged defective ISPpu9 copy. It is not clear how frequent this type of structure may be or whether it occurs at all with other family members but should be kept in mind when undertaking large scale genomic analyses.
It includes a junction of the right (RE, called box B by the authors) and left (LE, called box A’) ends separated by a characteristic AG dinucleotide (a characteristic dinucleotide which flanks ISPpu9 insertions [32]). This was identified from an analysis of the Pseudomonas putida KT2440 genome which carries seven ISPpu9 copies, each inserted site-specifically into one of the more than 900 35bp highly conserved REP sequences (Repeated Extragenic Palindromes) [32] (see: Circle formation and the integration of the IS110 group:ISPpu9) . The insertions are flanked by a 2 bp dinucleotide (5’AG 3’). Two types of ISPpu9 derivative with intact transposases (Fig. IS110.7A, i and ii) were indentified: two ISPpu9 copies which we will call wildtype (wt; Fig. IS110.7A, i) and five copies of the ISPpu9 catalogued in ISfinder (Fig. IS110.7A, i). Moreover, three copies of a third (defective) ISPpu9, devoid of the tnp gene but including both left (LE, called box A’) and right (RE, called box B’) ends were also identified (Fig. IS110.7A, iii).

These were called “orphans”. They are in fact IS110 family MITEs. The catalogued IS carries an extension on the right which includes an abutted right and left end separated by an AG dinucleotide (Fig. IS110.7A, ii). This resembles the junction expected to form in a circular transposition intermediate (see: Transposon Circles below) while the region downstream is similar to, but diverges from, the non-coding region upstream of the transposase gene (Fig. IS110.7A, i, top). These similarities and differences between the upstream NCR and the sequence of the “orphan” were pointed out by Gomez-Garcia et al [32]. It produces an RNA which the authors called Ssr9 (see Mechanism: ISPpu9 and regulation by RNA below) which was also identified in other Pseudomonas putida strains: in Pseudomonas sp KBS0802, immediately downstream of the tnp genes in five cases with one in tandem and three independent copies; in Pseudomonas putida NCTC13186, immediately downstream of six of the seven tnp copies with an additional ssr9 gene in tandem in two of these, and four independent copies, two of them in tandem, in different genomic locations. This suggested that the ISPpu9 copies could transpose independently (“detach from the tnp gene” [32]).
The LE and RE of all 7 ISPpu9 copies were identical in sequence as were those of the accompanying MITE. However, the LE differed in sequence by a single base pair and the MITE RE differed by 3 bp from their ISPpu9 counterparts (Fig. IS110. 7B; [33]. In addition, LE of both the ISPpu9 and MITE moieties carried a short inverted repeat not present in the RE or in many other IS of this family.


These studies were extended to an analysis of additional Pseudomonas sp strains. Using the Pseudomonas putida KT2440 ISPpu9 transposase gene, tnpISPpu9 as a query, similar genes were identified in multiple copies in nine different Pseudomonas putida strains and one strain of P. plecoglossicida. All were flanked by LE and RE copies (Fig. IS110.7C).
These analyses confirmed that the MITE was only found in strains KT2440, NCTC13186 and KBS0802 [32][33] and since all three strains contained seven ISPpu9-MITE copies in the same genomic context, the authors concluded that the three strains evolved from a common ancestor. Moreover, the fact that the same differences between the ISPpu9 and associated MITE LE and RE occurred in each IS copy, it is probable that the association occurred prior to amplification (transposition) of the ISPpu9 genomic copies. Minor structural variations were observed between the strains: in particular, a tandem duplication of the ISPpu9 MITE at some loci and, in one case, the acquisition of an associated MITE [33] indicating subsequent diversification in the individual strains.
Transposase Coding Sequence.
The single long, relatively well conserved, transposase reading frame shows some clusters of conservation within the N- and C-terminal portions. One characteristic which distinguishes IS110 family members from all other elements whose Tpases exhibit a predicted RNase fold is that the predicted catalytic domain of their DEDD Tpases is located N-terminal to the DNA binding domain [25][21] (Fig.IS110.1). In the DDE Tpases it is generally located downstream towards the C-terminal end of the protein. The alignment shown in Fig.IS110.5, based on 149 IS110 and 187 IS1111 group members, shows that the N-terminal catalytic domain of both IS110 and IS1111 groups share significant identities.
It had been noted that the DEDD region resembles a site-specific recombinase similar to the Piv invertase from Moraxella lacunata and Moraxella bovis [21][34]. In the absence of a suitable assay for IS492 activity at the time, the function of the DEDD residues was investigated using the Moraxella Piv inversion system where it was first shown that a mutant E59G of the DEDD motif was unable to accomplish inversion at the Piv recombination sites although it had no apparent effect on DNA binding [21]. Further mutational analysis confirmed that all conserved DEDD residues are required for Piv inversion [34]. It was also pointed out that the DEDD motif (and therefore the equivalent DEDD transposase motif) is analogous to the catalytic center of the RuvC Holliday junction resolvases.
The probable C-terminal DNA binding domains of the two groups vary somewhat from each other (Fig.IS110.8A). Those of the IS1111 group show significant conservation compared with IS110 group members, perhaps reflecting the different types of ends carried by each group. It has been pointed out that, while the C-terminal transposase ends are somewhat variable, both the IS110 and IS1111 subgroups show a conserved SG residue [28][18]). Moreover, as can be seen from Fig. 110.8B, the shared conserved residues are not restricted to SG but are somewhat more extensive.


These results were confirmed more recently by Siddiquee et al.[28].
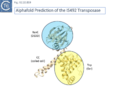
Predicted Transposase Structures of IS110 and IS1111 group Members show Identical Domain Structures
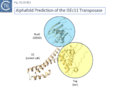
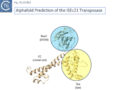
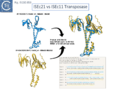
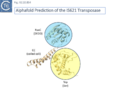
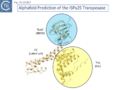
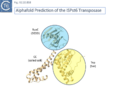
Siddiquee et al., [28] used AlphaFold to predict the structure of several IS110 family transposases including ISEc21 (IS110 group) and ISEc11 (IS1111 group). Not unexpectedly, both these transposases are remarkably similar and also closely correspond to the structure obtained from cryo-em [35]; Fig.IS110.43 and Fig. IS100.45). AlphaFold predicted the three domain structure composed of an N-terminal RuvC-fold catalytic domain carrying the DEDD amino acid cluster (Fig. IS110.8C), a C-terminal domain carrying the catalytic Serine (Tnp) and a coiled coli domain composed of two α-helices separated by a variable linker region. Both dimer and tetramer structures were also predicted and proved to be remarkably accurate. Fig. IS110.8C shows the AlphaFold predicted monomer structures of the IS110 and IS1111 transposases, TnpIS110 and TnpIS1111, and Fig. IS110.8D shows the overlay of these structures using the FATCAT software package, confirming that they have highly similar structures. Figures Fig.IS110.8S1-9 presents the predicted structure and pairwise comparisons of additional members of the IS110 and IS1111 groups. These data strongly suggest that the reaction mechanisms of both groups are quite similar and provide strong support for including both the IS110 and IS1111 groups into a single family.


- IS110.8S.
IS110.8S1.
IS110.8S2.
IS110.8S3.
IS110.8S4.
IS110.8S5.
IS110.8S6.
IS110.8S7.
IS110.8S8.
IS110.8S9.


Transposase activity
The close relationship between DEDD Tpases and the Piv/MooV invertases which resolve Holliday Junctions (HJ) structures during inversion [36] suggests that transposition of DEDD Tpases encoding IS may be unusual and involve Holliday Junction (HJ) intermediates [37] which are resolved using a RuvC-like mechanism [38]. The presence of the conserved serine residue (Fig. IS110.8B) is consistent with a site-specific recombination mechanism. Together with the difference in domain organization between the DEDD (Fig. IS110.8A) and DDE Tpases, these obseravtions reinforce the idea that the two IS types possess entirely different transposition mechanisms.
Few data were initially available concerning enzymatic activities of the putative Tpases of this family of elements: the IS900 Tpase was detected by immunological methods in the Mycobacterium paratuberculosis host [39].
Subsequently, other IS110 transposases have been purified and their properties investigated. These include those of ISEc11, ISKpn4, ISPa11, ISPst6 (IS1111 group) and ISEc21 (IS110 group) [28] and IS621 [18]. Interestingly, they all co-purify with, or have high affinity to, an IS-specified RNA species (see: A Specific Guide RNA direct target choice).
Mechanism
IS110 family members generate circular double strand DNA intermediates.
The early observation that another Streptomyces coelicolor IS110 family member, IS117, occurred in a circular form which integrated in a target DNA at a frequency two orders of magnitude higher than when cloned as a "linear" copy [40] led to the idea that IS110 family transposition occurs by production of an excised double stranded circular DNA IS intermediate (Fig. IS110.9).
Henderson et al, 1989[40] were perhaps the first to suggest that this family used site-specific recombination to transpose. IS117, originally identified as a “mini” circle shows a 2/3 base pair identified now called the “core” sequence (from the core nucleotides involved in cleavage during site-specific recombination; see: Transposons_families/Tn3_family#Resolution) between the circle junction and its specific site of insertion into the host chromosome [40][41][42] (Fig.IS110.9). Transposition was often found to result in tandem dimer inserts, behavior which might indicate some type of rolling circle insertion mechanism such as observed in the case of the IS91 family elements.
All family members analyzed from both the IS110 and IS1111 groups produce double strand circular transposon copies in vivo generally detected, using PCR, as DNA “junction” fragments carrying abutted IS ends. Their nucleotide sequences have also identified a single copy of the core sequence (the short nucleotide sequence flanking an inserted IS; see: Fig. IS110.5) in all family members: these include junctions of: IS117/IS116 (IS110) (Fig. IS110.13) [40][41][42][43], IS492 (IS110) [44][45], IS1383 (IS1111) [46], ISEc11 (IS1111) [47], IS4321/IS5075 (IS1111) [17] , ISPa11 (IS1111) [17], , ISEc21 (IS110) (see Fig.IS110.11) and ISPpu9 (Fig. IS110.7B and C ; Fig. IS110.16E) [33]. In earlier studies, circle junctions with interstitial sequences of various length have been reported e.g. IS117, 3, TAG [40][48]; IS492, 5bp [44][49]; IS1383, 10bp [46] comprising the two 5bp flanks.
In the case of the IS110 family member ISPpu9 with its accompanying MITE (Fig. IS110.7A; Fig. IS110.23A), multiple types of circle are observed by PCR[33]): minicircles of ISPpu9 itself (carrying the transposase gene), of the ISPpu9 MITE (specifying an RNA, ssr9, alone; Fig. IS110.23A) and of the entire ISPpu9-MITE structure could be detected indicating that all four IS ends (Fig.100.7A and B) are active. Following cloning and sequencing, all junction fragments carried an AG dinucleotide flanking sequence between the abutted ends.
In all cases examined, circle formation is dependent on the presence of an intact transposase gene. For IS492 at its eps site precise excision in Pseudomonas atlantica and circle formation in E. coli requires between 5 and 10bp flanks on both LE and RE
More detailed requirements for both circle formation and for IS insertion have been determined for a number of family members. These include ISEc21, ISPpu9 and ISPpu10 [33] of the IS110 group and ISEc11 of the IS1111 group (below). The exact molecular mechanism of IS110 family circle formation, however, is yet to be elucidated.
Circles could be generated by a copy-out-paste-in mechanism as adopted by IS families such as IS3, IS30 or IS256 family members or alternatively, in light of the similarities of the IS110 family transposase with site-specific recombinases, by site-specific recombination between the repeated flanks (Fig. IS110.9). In the latter case, unless there is a specific function which maintains the IS in its donor site (e.g. IS200/IS605), transposition might be expected to generate an empty donor site.
In early studies with IS117, no empty site was detected following transposition from the single chromosomal locus occupied by the IS to other sites [42]. On the other hand, IS492 was found to precisely excise from its site in the eps gene in Pseudomonas atlantica restoring eps activity.
However, since excision from the eps::IS492 was significantly higher than that of four additional IS492 copies at different chromosomal locations, and was correlated with a higher transcription level, it remains possible that precise excision is a special case.

Circle formation and integration of the IS110 group: ISEc21
ISEc21 was identified in 5 copies in the E. coli E2348/69 chromosome each with an identical target sequence (Iguchi and Hayashi, 2008. Direct submission to ISfinder). The target sequence was confirmed by Siddiquee et al., [28] (Fig. IS110.10 and 11) and, furthermore, shown to be a sequence including and surrounding the central D of the DDE motif of IS3 family members (e.g. ISCfr6, ISEc92, ISEc93). ISEc21 transposition has been studied in some detail [28].
The requirements for transposition activity were examined using a plasmid-cloned ISEc11 copy including ~100bp of flanking DNA (Fig. IS110.10 top). Abutted IS ends, presumably circular transposition intermediates, were detected by PCR, and the junction sequence with the junction promoter determined (Fig. IS110.10 top). Deletion of the upstream NCR sequence (bp 20 – 150) eliminated detectable circles. In addition, insertion into a suitable target DNA (involving both circle formation and insertion) was monitored by PCR reactions at both insert juntions (Fig. IS110.10, A) and was eliminated by deletion of the NCR (Fig. IS110.10, B). However, providing NCR in trans under control of a T7 promoter on a third plasmid, restored the entire reaction (Fig. IS110.10, C). This is analyzed in more detail below (see: Analysis of ncrRNA for a Second IS110 Group Member: ISEc21.).
This system was also used to investigate the target sequence requirements which, although not systematic, clearly demonstrated that target specificity was robust and depended on a surprisingly small number of conserved nucleotides: 5/6 consensus nucleotides on the left and 5 on the right or only 3 on the right still permitted IS circle formation and insertion (Fig. IS110.11). However, mutation of a single base pair of the dinucleotide CA flank, prevented insertion.


Circle formation and integration of the IS110 group: ISPpu9.
In contrast to ISEc21, whose analysis used a plasmid-based system, a detailed analysis of ISPpu9 circle formation and insertion employed a system based on IS located in the host chromosome [33].
One particularity of this IS is the presence of a conserved internal inverted repeat located in LE (Fig. IS110.7B and C) which has not been noted in other family members. This was thought to be important since, as shown below this is partially conserved in the ISPpu9 target sequence (Fig. IS110.16; [50]).
A number of ISPpu9 derivatives with their flanking sequences were constructed, cloned into a mini-Tn5-carrying suicide plasmid and delivered to the chromosome of P. putida strain F (Fig. IS110.12). Their capacity for circle formation was assessed by PCR. Deletion of either LE or RE eliminated circle formation as did mutation of the terminal 5 bp of RE and of the 3’REP sequence (Repeated Extragenic Palindromes) together with the G nucleotide of the core AG dinucleotide (Fig. IS110.12 middle). Surprisingly, neither substitution of the internal IR within LE or within the right flank affected the level of IS circles.
For two mutants, a 5 bp substitution within RE and a 5 bp substitution at the tip of LE, a larger junction fragment was detected, possibly in higher quantity. This proved to be generated by recombination between one flanking AG copy and a second located next to a NotI restriction site used in cloning the IS (Fig. IS110.12 bottom).

Circle Excision and Insertion Specificity of Additional IS110 and IS1111 Group IS.
A number of studies which have investigated the sequence specificity of insertion of various members of the IS110 family are summarized in the following:
IS117 was one of the earliest IS110 family members to be identified and analyzed. It has a 3 base pair core sequence.

Another member of the IS110 group, IS492, clearly undergoes Tpase dependent precise excision to regenerate a functional eps gene in Pseudomonas atlantica (Fig.IS110.14 A). The inserted IS copy is flanked by 5 bp directly repeated sequences (5’-CTTGT-3’) (Fig.IS110.14 B). The circle junction carries a single copy of this sequence (Fig.IS110.14 C) as does the empty target site. This suggested that one copy is carried by the IS and is required for activity. Sequential deletion of the ends of (Fig.IS110.14 D) clearly showed that the pentanucleotide and/or sequences immediately upstream were required for excision. On the other hand, a sequence 5’-GTTT-3’ located upstream in those insertions analyzed (Fig.IS110.14 E) was not required for excision. It is possible that they are needed for circle integration.


Similar flanking sequences have also been identified in insertions of IS900, IS901, IS902, IS116, IS1110, and IS2112 (Fig.IS110.15) and IS621 was also shown to have a flanking sequence, in this case a dinucleotide, CT [25].

In the case of the IS110 family member ISPpu9 with its accompanying MITE (Fig. IS110.7A; Fig. IS110.23A), multiple types of circle have been observed[33]. In all three circular species one of the flanking “core” dinucleotides (an AG in this case; Fig. IS110.7A, B and C) was retained at the circle junction between the abutting LE and RE.
Like a number of IS110 family members (Fig. IS110.16) ISPpu9 had been observed to insert into Pseudomonas REP sequences at a specific site (Fig. IS110.16, B; [50]). Likewise, all seven P. putida KT2440 ISPpu9 copies had inserted at the same site, an observation reinforced by the upstream and downstream flanks of another 47 ISPpu9-like ISs from the Pseudomonas Genome Database.
The insertion specificity was also confirmed experimentally by conjugating a suicide plasmid carrying either a kanamycin (Km) or Gentamycin (Gm) resistant-tagged ISPpu9 into the ISPpu9-free P. putida strain, F1, which contains over 300 intergenic REP sequences (Fig. IS110.16, E).


Transposon Circles and insertion specificity: IS1111 group
The ends of IS1111 group members differ from those of the IS110 group by including short subterminal IRs (ISLst and IRRst). IS1383 was identified as flanking insertions into each end of the IS5 family member, IS1384 [17][46] and was also shown to generate IS circle junctions (Fig.IS110.17 A). Like most members of this group, IRLst is located further from the IS tip than is IRRst. In this case IRLst is preceded by the sequence 5’-agatgg-3’ (lower case indicates the IS end sequences upstream and downstream of IRLst and IRRst respectively). The insertions into the ends of IS1384 had occurred into a resident AG(A) sequence and excision to form the circle junction appeared to have occurred by recombination between the resident AG(A) and the terminal aga at the left end of IS1383 [46]. This this is compatible with a site-specific recombination mechanism in IS1383 transposition. A similar arrangement was observed for a second IS1111 group member, ISEc11 [47], where a flanking tetranucleotide AAAT also appeared as part of the circle junction (Fig.IS110.17 B) and it has also been argued that this is compatible with a site (sequence)-specific recombination transposition mechanism [47]. However, in two additional cases from the Hall lab, IS4321/IS5075 and ISPa11, no such “micro-homologies” were detected [17] (Fig.IS110.17 C and D). However, it should be noted that transposon circles are generated in vivo and analyzed by PCR. Since there may be a number of copies of the IS in the host genome, this might compromise the sequence of the PCR product.

The number of fully studied examples of IS1111 group members is limited, it is possible that the flanking “micro-homologies” observed for IS1383 and ISEc11 are chance occurrences and that excision and insertion of IS1111 members is truly mechanistically different from those of IS110 group members and that their division into separate families is justified. However, for present classification, both groups are included in the IS110 family in ISfinder for convenience.
Insertion specificity and target secondary structures
The particular insertion specificities of the IS110 family has been mentioned in the context of the mechanism of transposition and is often one factor in making definition of the IS ends difficult. However, one characteristic of insertion of this family of IS is that they often prefer sequences with the propensity to form secondary structures. This is consistent with the fact that the transposases are similar to the RuvC and the RuvC endonuclease is involved in resolving branched Holliday junctions during recombination (e.g.[51]).
For example, IS621 insertions were observed to be flanked by a CT dinucleotide [25]. On further examination this was shown to be a dinucleotide located at the foot of Rep sequences in the host Escherichia coli genome (Fig.IS110.16 A). REP sequences are small Repeated Extragenic Palindromic sequences often present in many hundreds of copies in bacterial genomes and which play a variety of structural and regulatory roles [52][53][54][55][56][57][58]. Both Z1 and Z2 Rep [53][54][55] sequences are used as targets and all 10 copies of IS621 in the E. coli ECO28 genome were found in this position in resident Rep sequences [25].
There are at least six other examples of this type of “structural” insertion specificity (Fig.IS110.2). All 7 copies of ISPpu10 were identified in short REP sequences of Pseudomonas putida KT2440 [59][60] and a cloned ISPpu10 derivative was shown experimentally to transpose into this REP target [59] (Fig.IS110.16 B). Seven (of 7) copies of a related IS, ISPup9, were identified in similar REP sequence at the same position but inserted in the opposite orientation (i.e. on the opposite strand)[61] (Fig.IS110.16 B) while 4/4 examples of ISRm19 were identified in a REP sequence of Rhizobium meliloti (Fig.IS110.16 C). Similarly, ISPa11 of the IS1111 group inserts specifically into a Pseudomonas aeruginosa REP (6 examples) [61] and one example from Partridge and Hall [17] (Fig.IS110.16 D).
Two types of Insertion have been described [61]. In type 1, the IS inserts at the same position within the REP whereas type 2 insertions occur adjacent to a REP. Most IS110 family members exhibit type I insertion patterns in all examples identified. However, one IS, ISPsy7 exhibited type II insertion pattern but only in 6/10 examples and a second unspecified IS from Neisseria meningitidis MC58 was also reported to exhibit a type II pattern in 3/5 cases examined [61]. It is possible that this N. meningitidis IS is the same as that described by Skaar et al. [27].
At least six different members of the IS1111 subgroup (ISKpn4, ISPa21, ISPst6, ISUnCu1 = ISPa62, ISAvX1 = ISAzvi12 and ISPa25) show a preference for another type of target which can assume a structured configuration, the attC sequences of integrons [30][62]. IS which insert into attC sequences are grouped into a specific clade (Fig.IS110.2) [62]. The integron attC is central to integration of circular integron cassettes [63] and had been called “59 base pair element” [64] but can vary considerably in length [65]. Studies from the Mazel lab have shown that attC sequences can form foldback structures (Fig.IS110.18 A) with imperfect matches in which extrahelical bases are involved in driving the direction of the excision and integration reactions [63][65][66][67]. Integration of IS1111 group members appears to occur at a specific position on these attC foldback sequences (Fig.IS110.19).
Other IS of this family also appear to insert into conserved target sequences: IS1533 occurs in 84 copies in Leptospira borgpetersenii and inserts into a partially conserved sequence (ttAGACAAAA [IS1533] TATCAGagcc-gtct--aaa); ISRfsp2 from Roseiflexus sp RS-1, present in 40 copies in the host genome, is flanked by the sequence, CTCtGCGaaCGCtGCGc [ISRfsp2] CTCtGCGGtg (Fig.IS110.20) while ISMpa1 from Mycobacterium avium subsp. Paratuberculosis is flanked by the consensus CCAGN0–1CTA [ISMpa1] GCCN0–6GCCG [68].


Extensive Bionformatic Analysis of Target Sequences
Siddiquee et al.,[28] undertook an extensive analysis of the IS110 family members in ISfinder using a library of IS together with their flanking DNA extracted from public databases and ranked in order of abundance and number of independent insertions (https://github.com/ AtaideLab/Targets/31). The different IS were found to occur with a very large range of frequencies. A number were represented only once in the library while others from both IS110 and IS1111 groups were present in very high numbers: some in several thousand with hundreds of unique insertion events.
Analysis of these data using WebLogo revealed that the consensus target sequences with large differences between different IS in the strength and length of the conserved sequence (Fig. IS110.21, A and B).


Transposase expression
Like many other IS which use double strand circular intermediates, circle formation often results in the assembly of a junction promoter formed from a -35 promoter element in the right end oriented outwards and a -10 promoter element in the left end oriented inwards [69][70][71]. For the IS110 family, this was originally identified in circular forms of IS492 [44] (Fig.IS110.22). which was significantly stronger than the lacUV5 promoter , and has also been demonstrated for a number of others (e.g. ISEc11 and a naturally occurring derivative, ISEc11p, IS621 and ISPpu10 [33].
A list compiled of many IS1111 group IS [17] and in silico construction of IS circle junctions indicated that all had the capacity to generate probable promoters. Due to small variations in the distance of the subterminal IRs from the probable end of the IS, some were separated by 10 bp and some by 9 bp. A notable observation for the IS1111 group is that while the -35 promoter elements are located entirely within the right IS end, the -10 promoter element was not located entirely within the left end but was composed of sequences from both the left and right ends and was only assembled on circle formation.
Few of these have been examined for activity. However, not all family members appear to specify a junction promoter. For ISPpu9 (IS110) no junction promoter was predicted using the Pseudomonas-specific promoter prediction tool (https://sapphire.biw.kuleuven.be/index.php) and no junction promoter could be demonstrated using β-galactosidase translational fusions (Fig. IS110.23B). However, the ISPpu9 (IS110) transposase promoter appears to be strong and, the authors argue, this alleviates the necessity for the transient junction promoter. In the same study, the circle junction of ISPpu10 generated a robust promoter[33] (see Fig. IS110.18, B Bottom and Fig. IS110.23, B).

Transient Promoter Formation: the circle junction
It is important to note that there are some ambiguities in a number of the ends of IS110 family members documented in ISfinder due to the absence of terminal IRs as pointed out by Siddiquee et al., [28] the most definitive method of resolving these problems would obviously be to obtain the DNA sequence of the RE-LE IS circle junction and to compare this with an empty target site.
ISPpu9 and its Regulation by asr9 RNA
One of the first suggestions that control of transposition of IS110 family members might involve RNA came from studies on ISPpu9 [32] (Fig. IS110.3A and IS110.3B and IS110.7A).
ISPpu9 and its Regulation by asr10 RNA
An analysis of transcription in Pseudomonas putida [72] led to the identification of two untranslated regions (NCR) in ISPpu9 from which two small RNAs (sRNAs) are produced: one, ssr9, is located downstream of the tnp gene (tnpISPpu9) expressed from the probable defective ISPpu9 MITE-like structure (Fig. IS110.7, A) in the same direction and the second, ars9 (antisense sRNA of ISPpu9), is located upstream, convergent with the transposase promoter and expressed from the opposite DNA strand (Fig. IS110.23, A). Asr9 was determined to be nearly 5 times more abundant than ssr9. Tnp ISPpu9 transcripts were only detected at very low levels.


Inspection of the sequences of both asr9 (upstream) and ssr9 (downstream) indicated a significant divergence (Fig. IS110.23 and Fig. IS110.24) which presumably eliminates the asr9 promoter in the downstream ssr9 sequence although both maintained an upstream inverted repeat.

Clearly, asr9 could act as an anti-RNA to control transcription/translation of the tnp gene. To investigate this, a series of plasmid-based Tnp-lacZ translational fusions were constructed (Fig. IS110.25). These included derivatives containing either the first two tnp codons (called 2 and 2+S, Fig. IS110.25, 1 and 2) eliminating the ars9 -35 promoter component or the first 8 (called 8, 8+S and ; Fig. IS110.25 3, 4 and 5) which include the entire ars9 promoter (Fig. IS110.25, 3 and 5) or a copy with a mutated -35 promoter component (Fig. IS110.25, 4). The 2 and 8 tnp codon derivatives were also constructed with (Fig. IS110.25, 2 and 5) or without the corresponding downstream ssr9 promoter (Fig. IS110.25 1 and 3).
Propagation of these plasmids in Pseudomonas putida F1 (which is devoid of ISPpu9 or associated genes) revealed that plasmids 8 and 8+S (Fig. IS110.25, 3 and 5) produced significant levels of ars9 RNA while plasmids 2 and 2+S1 and 2 (Fig. IS110.25, 1 and 2) did not. The plasmid which had a mutated -35 promoter box (Fig. IS110.25, 4), however continued to produce a low level of the RNA. Measurement of β-galactosidase activity from these plasmids in Pseudomonas putida F1 (which is naturally devoid of ISPpu9 sequences) revealed that plasmid S (Fig. IS110.25, 1) was only 25% that of construct 8 (Fig. IS110.25, 3) although the levels of lac mRNA were only 70 % lower suggesting that the major effect of ars9 RNA was on translation.
The authors propose that the tnp ribosomal binding site in the mRNA is masked by the inherent secondary structure and that interaction with ars9 RNA liberates this, facilitating TnpISPpu9 translation (Fig. IS110.25 bottom). Moreover, introduction of an ars9 gene into the chromosome of Pseudomonas putida F1 further significantly increased β-galactosidase expression from plasmid 8 (Fig. IS110.25, 3). However, this expression enhancement did not occur with plasmid 2 (Fig. IS110.25, 1) and the authors suggest that this could be because asr9 cannot properly hybridize with the NCR RNA of plasmid 2 possibly because the sequence between codons 2 and 8, plasmid might be important for asr9 activity by, for example, providing an initiation point for pairing. This was not further tested.
Additionally, the presence of ssr9 appeared to alleviate the effect of ars9 suggesting that this RNA, with partial identity to the upstream NCR (Fig. IS110.23), might be able to sequester ars9 thus reducing its activity. Such an interaction was detectable in vitro. This effect was observed in Pseudomonas putida F1 as a 27% lower β-galactosidase level from the 8+S plasmid than from the 8 plasmid and a 35% lower level in the Pseudomonas putida KT2440 host.
The notion that the NCR secondary structure is responsible for sequestering the translation initiation signals is supported by the observation that a number of mutations designed to disrupt or weaken the NCR secondary structure and therefore demask the ribosome binding site resulted in a large increase in β-galactosidase expression in the absence of ars9.
Using lacZ transcriptional fusions, the activities of Pars9 and Pssr9 were found to be about 3 fold higher than Ptnp and ars9 RNA was significantly more stable (half life >60 min) than ssr9 (half life ~3 min). The authors present experiments which lead to the conclusion that asr9 stability is due to its sequence and secondary structure rather than to interaction with ssr9 or the 5’NCR RNA.
It should be noted that these studies addressed “linear” IS copies and did not involve the presumed circular intermediate (see: Transient Promoter Formation: the circle junction). Regulation of Tnp expression among other characteristics is likely to be modified in these transposition intermediate structures.

ISPpu10 and its Regulation by RNA
A similar analysis of ISPpu10 also from P. putida KT2440 showed that it too specified an asr RNA, asr10 (Fig. IS110.26). Moreover, as judged by transcriptional fusions to lacZ, the asr10 promoter (Fig. IS110.26, 5) was significantly stronger than that of the transposase with or without the convergent asr10 promoter (Fig. IS110.26, 3 and 4) which appeared to be significantly weaker than the ISPpu9 Ptnp. In the case of ISPpu10, the circle junction assembled a very strong promoter (Fig. IS110.26, 2)[33].

RNA from the NCR may be Involved with Target choice and Integration
NCR RNA from IS110 group members:IS621
The involvement of an RNA from the downstream NCR in determining IS1111 group insertion specificity had been suggested [30] based on comparison of ISKpn4 and ISPa25. ISKpn4 belongs to an IS1111 subgroup targeting att sites of integron cassettes (Fig. IS110.3A) and while ISPa25 also targets att sites, it belongs to an IS1111 subgroup including IS4321 and ISPa11 (Fig. IS110.3A) whose transposases have low amino acid similarity with the ISKpn4 subgroup and targets the IR of Tn21 transposons. It was noted that ISKpn4 and ISPa25 share a block of sequence similarity in the downstream non-coding region (Fig. IS110.27) and it was suggested that, as RNA, this might be responsible for target choice. More careful analysis presented here has revealed that the two IS also share blocks of similarity at the 3’ end of their transposase genes and that this results in strong amino acid conservation in the transposase itself (Fig. IS110.19). The first block of similarity carries the G..P/SG conserved residues (Fig.IS110.8B).


Moreover, Durrant et al [18][19] extracted and aligned a large number of examples of this family from public databases (2023) (Fig. 110.3B) which greatly increased the number of family members in the ISfinder database. They observed that, compared to other IS families, members of the IS110 family exhibit some of the longest non-coding ends (NCR or Untranslated Regions, NCR) among IS families. That this is a conserved family feature is suggested by a relatively narrow length distribution (between 230 and 290 bp).
Identification of Specific NCR from IS621 (IS1111) with Strong Transposase Affinity
To further explore the mechanism involved in IS110 transposition, Durrant et al [18][19] used IS621 of the IS110 group as a model system. IS621 (Fig. IS110.2, B) was first described by Choi et al [20] and comparison of a number of resident IS621 homologues in E.coli demonstrated that they insert at the foot of a REP sequence and are flanked by a CT dinucleotide (Fig. IS110.18). IS621 has both upstream and downstream NCR sequences (Fig. IS110.6A and Fig. IS110.27A). The predicted RE-LE junction of the probable IS621 circular transposition intermediate was cloned together with the tnp upstream NCR and analyzed for RNA expression in E.coli [18][19]. A prominent RNA region of approximately 170 nts was identified which appeared to originate just downstream from the junction promoter and continue until immediately before the TnpIS621 +1 codon (Fig.IS110.28).

Using purified TnpIS621 and in vitro transcribed ncRNA, it was found, using Microscale thermophoresis (MST) to determine the equilibrium dissociation constant, that the protein showed high affinity for the RNA. This is a characteristic of guide RNAs in other systems where they co-purify with their guide endonucleases (see: IS200/IS605 family: TnpB and its Relatives).
A Consensus ncRNA Double Loop Structure for IS621 Orthologues
A consensus ncRNA (non-coding RNA) structure was then determined for over 100 IS110 orthologues using structural alignments and structural prediction software together with sequence conservation. Development of a covariance model revealed the presence of a 5’ stem-loop followed by two larger stem-loop structures each with a large internal loop (Fig. IS110.29). The first had low sequence conservation while the second was significantly more conserved.

The strong binding of the ncRNA to the Tnp protein raised the possibility that it may favor target recognition.
Extending the Consensus to Other Group Members: ncRNA Complementarity with Donor Junction and with Target
To explore this, the authors first defined the ends of a large number of IS110 elements enabling identification of their insertion sites and reconstruction of both the target sequence and the junction of the circular form. They then performed an iterative search with the structural covariance model (CM) developed for IS621 ncRNA (Fig. IS110.29) to predict ncRNA structures in the LEs of this IS collection, generated paired alignments of the ncRNAs with their corresponding target and donor (abutted LE and RE ends) using a 50bp window centered on the donor “CT” dinucleotide core, and undertook covariation analysis (2,201 donor - ncRNA pairs and 5,511 target - ncRNA pairs) detected by homology with IS621 [73]. This incorporated base-pairing analysis to identify stretches of these ncRNA complementary to either the top or bottom strand of the target or donor DNA. It identified possible pairings with the two internal ncRNA loops. By projecting the overall covariation pattern for the entire collection onto the model IS621 ncRNA sequence, the authors inferred that the first loop could base-pair with the target and the second to the donor junction: the 5’ side of the loop would pair with the bottom target donor strand (8-9 nts) and the 3’ end with the top strand (4-6 nts) (Fig. IS110.30A) [18][19].


An Invasion Model for Bridging Donor and Target Sequences
These strong signals of covariation and base pairing led to the idea that ncRNA bridges the target sequence and the IS circle junction during transposition and led to the “invasion” model shown in Fig. IS110.31 [18][19]. In this model both upstream and downstream loops engage and align the target and donor DNA sequences facilitating recombination at the core by the DEDD Tnp (Fig. IS110.8.A) presumably with the aid of the conserved serine residue located in the C-terminal domain as the nucleophile (Fig. IS110.8.B). The authors underline the observation that the “core” dinucleotide is included in all 4 of the base pairings (Fig. IS110.30A). Thus there is an overlap between top- and bottom-strand pairings precisely at the core dinucleotide. This presumably plays a key role in the recombination (cleavage and strand exchange) reactions which was confirmed by structural studies (below).
The covariance data also suggested that the IS621 right target guide sequence (RTG) is short and that other members of the IS110 group include longer RTG (Fig. IS110.30A- note the purple extension on the Upstream Loop, Top strand). This is indicated on the IS621 sequence by the red ribonucleotides (see also Insertion in vivo)
An Efficient in vitro Recombination Reaction: ncRNA Functions to Bridge Donor and Target.
An in vitro IS621 recombination reaction was assembled to test this idea. This was composed of an in vitro-transcribed ncRNA, the purified IS621 transposase/recombinase and short, double stranded oligonucleotides containing the target and donor sequences. The reaction mixture also included NaCl and MgCl2.
Microscale thermophoresis (MST) experiments demonstrated that the ncRNA-transposase/recombinase complex bound both donor and target DNA molecules in a sequence-specific manner. This combination of components led to the expected reciprocal DNA exchange reaction at the CT “core” site with the expected junctions as detected by appropriate PCR assays. Since the ncRNA was capable of binding both the donor IS circle junction containing abutted RE and LE as well as the target, Durrant et al [18][19] have called it a Bridge RNA (Fig. IS110.31).

Testing the Model: an in vivo Plasmid-Based Integration System.
Further support for this “invasion” model was obtained from experiments designed to reprogram either donor or target sequences. The experiments used a 2 plasmid system in vivo: one plasmid, pTarget, carried tnpIS621, the 50 bp target site (a REP sequence) and a flanking promoter; the other, pDonor carries the RE-LE donor circle junction, the bridge RNA and a promoter-less gfp gene. Donor-target recombination places gfp under control of the pTarget promoter (Fig. IS110.32) and can be assayed by measuring fluorescence. This assay was used to monitor the effect of mutations in TnpIS621: alanine substitution of the conserved catalytic residues, DEDD, of the RuvC-like domain (Fig. IS110.8A) or the recombinase domain, S, (Fig. IS110.8B) abolished activity. Gfp expression was measured using a flow cytometer by scraping and resuspending colonies from a plate after co-transformation of a recipient strain with the two plasmids under standard plating conditions. In a number of cases, the plasmid sequences were also obtained to confirm the recombinant structures.

Reprogramming Bridge RNA
The assay was also used to determine whether the target sequences could be changed. A number of changes to the target loop sequence were made (Fig. IS110.32 and Fig. IS110.33) and tested against wildtype target sequence and the corresponding (complementary) target sequence. The results demonstrated that changes in the ncRNA target loop sequences eliminate integration into the wildtype target sequence but result in robust integration into the corresponding modified target sequences (Fig. IS110.33). This sequence reprogramming provides convincing support for the invasion model (Fig. IS110.31). Although the junction promoter is likely to be strong (that of IS492 is stronger than placuv5; Perkins-Balding et al [74] also observed that supplying ncRNA in trans from a strong promoter can further increase the activity of ncRNA on integration (in this case for mutant T5, by almost 2 fold.
Target specificity can therefore be modified by changes in the sequence of the target binding loop sequence.

Flexibility in IS621 Target Specificity.
The flexibility of target recognition was further explored [18] using a plasmid-based high throughput method. One plasmid carried the target (Fig. IS110.34, A) (together with a promoter), the bridge RNA orf (with the wildtype donor binding loop, DBL) separated by a 12 bp barcode, a chloramphenicol resistance gene and the tnpIS621 gene driven by an inducible T7 promoter (Fig. IS110.34, B). The donor plasmid carried the wildtype LE-RE junction (Fig. IS110.26, A) (together with an Ampicillin resistance gene and a promoter-less Kanamycin resistance gene). Integration of the donor into the target would bring the inactive kanamycin resistance gene under control of the promoter from the target site and result in KmR recombinants (Fig. IS110.26, B).

The target and TBL were cloned as a single oligonucleotide (Fig. IS110.35). The core CT dinucleotide was retained in all cases. Non-CT (core) target and corresponding LTG and RTG positions were then varied to assess single and double mismatch tolerance at each position. For this, several oligonucleotide sets were used and cloned by the Gibson method into a vector plasmid carrying the downstream donor binding loop (Fig. IS110.35). These were designed to test: 1) different target guides with single mismatch pairs; 2) double TBL and target mismatches; 3) negative controls ensuring none of the 9 programmable positions (excluding the CT core) matched in the TBL and target; 4) additional single mismatch combinations in TBL and target; 5) how mismatches in the dinucleotide CT core of the bridge RNA sequences affected recombination efficiency.
The results demonstrated that: full complementarity between the target and TBL was highly preferred (both single and double base mismatches severely impacted integration); integration occurred with sequence complementary changes over all positions in the target and TBL could be reprogrammed and reprogramming showed a large degree of flexibility over all positions.

Insertion in vivo: Reprograming the Target site.
In vivo insertion into the E. coli genome was investigated using a conditional replication defective plasmid with a 22bp wildtype IS621 donor sequence and a wildtype IS621 bridge RNA. Following inhibition of plasmid replication while maintaining selection of a plasmid selective marker, 144/173 unique insertions were identified in known Rep sequences: 96% occurred in the naturally observed target sequence (ATCAGGCCTAC) with only 2 with the exact target binding loop sequence (ATCGGGCCTAC) suggesting that the mismatch which would create an rG:dT base pair might be important; 4/10 of the most frequent integration sites may use an extended base-pairing of RTG and RT (i.e. 7 instead of 4 bp) since they are flanked by 5’-GCA-3’ which is complementary to the 5’-UGC-3’ immediately 5’ the RTG (red ribonucleotides in Fig. IS110.30A). Indeed, many of the orthologues naturally include longer RTGs (purple lozenges in Fig. IS110.30A).
Two reprogrammed bridge RNAs were designed to target two unique E. coli target sequences each with a 4 or a 7 RTG/RT base-pairing. While the most frequent insertion sites were observed to be those expected, some off-site insertions were also observed. These were greatly reduced with the extended 7 nt RTG compared to the 4 RTG bridge RNAs.
Reprograming the Donor site
The fact that the IS621 donor sequence was observed to be more conserved than the target sequence (see: Fig. IS110.30B) may render it more difficult to reprogram. To examine this, a system similar to that used in reprograming the target site was used but in which the bridge RNA was produced in cis from the donor junction sequence (Fig. IS110.36). Recombination was, again, designed to activate a KmR gene. Similar to the results of target-TBL sequence variation, donor- DBL mismatches significantly reduced activity.
Insertion in vivo: Reprograming the Donor site
The insertion activity of donor sequences was determined with the Gfp assay used to examine the target sequences. A number of donor mutants and their paired DBL (Fig. IS110.31: 1-9) were combined with a target sequence (Fig. IS110.33: 5) and its paired TBL sequence. The reprogrammed donor bridge RNAs yielded between 27 and 95 % of wildtype activity (Fig.IS110.31) whereas the wt donor performed poorly with each of the mutants. The reaction was dependent on an intact RuvC domain in the transposase.
This confirmed that, like the target loop, the donor loop sequences can be reprogrammed.

NCR RNA from IS110 Group Members: ISEc21.
Involvement of NCR RNA in ISEc21 Transposition
In addition to IS621, results of a detailed study of another IS110 group member, ISEc21 have shown that an RNA from the upstream NCR region is involved in interaction with the ISEc21 target DNA [28].
Small RNA was recovered associated with TnpISEc21 during purification. RNA seq. of this material produced a strong but extended peak in the upstream NCR (Fig. IS110.38, a). This was of three principal lengths which mapped to the upstream NCR region: nt 1-281, 90-163 and 90-147 (Fig. IS110.38, b). The position of the 3 sRNA spans a region which includes identities to the left and right halves of the of the target site while the entire ISEc21 NCR region, if expressed in its enrirety would also span sequences with identity to the donor site (Fig. IS110.38, c) as has been found by Durrant et al [18] for IS621. The reason for this difference is unclear but in view of the results from their studies on IS1111 group members (in particular ISPa11; Fig. IS110.42B), it seems probable that the longer RNA is biologically relevant and, we find, carries both the target guides and the downstream donor guides (not shown). Siddiquee et al., [28] have called this sRNA seek RNA since it shows complementarity to the target.
The activities of these sRNA in an in vivo coupled reaction involving excision and insertion of a derivative IS circle were tested in a system in which insertion could be monitored by activation of an mCherry gene (Fig. IS110.39). All constructs except RNA 90-163 gave positive results in this assay (Fig. IS110.38, b). One explanation for the absence of activity of this RNA is that the region between nt 147 and 163 may generate a structure unable to pair with the target sequence.


Exploring Bridge RNA Secondary Structures from Other IS110 Family Members
Durrant et al [18] also undertook a short survey to determine whether other members of this family also exhibited an RNA with similar structure to the IS621 bridge RNA. A bridge RNA was predicted in nearly 86% of IS110 group members in their library using the RNA covariance models. These were largely located at the left end (see also Fig. IS110.6). Three IS potential bridge RNAs were examined for complementarity to their donor and target sites. These are shown in Fig. IS110.40.1, Fig. IS110.40.2, and Fig. IS110.40.3 and their position on the phylogenetic tree is shown in Fig. IS110.3A. Perhaps surprisingly they include a diverse collection of secondary structures.
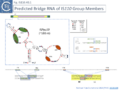
Fig. IS110.40.1. Predicted Bridge RNA from 3 IS110 group Members. Top of the figure shows a map of the IS as a yellow horizontal box containing a purple arrow representing the transposase gene and its direction of expression. The predicted secondary structure is shown below within the blue dotted line which also indicates its location on the IS, its polarity (5’ and 3’ ends), the IS name and length in nucleotides. A code showing the meaning of the symbols is included on the right. The structure shows the left and right target guide sequences (LTG and RTG) as green ellipses and the left and right donor sequences (which interact with the RE-LE junction; LDG and RDG) as brown ellipses. These interactions are indicated in the box on the right with the target and donor sequences appropriately color coded. For ISPpu10 and ISAar29, the bridge RNA sequence is included below with LTG, RTG, LDT and RDT sequences appropriately color coded in bold underlined and boxed and the blue lines indicating the orientation. The interaction of these sequences with the target and donor DNA is presented at the bottom with the complementary sequences boxed. The yellow boxes on the left represent the left and right ends of the IS in the donor junction joint, the substrate which undergoes integration.
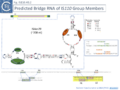
Fig. IS110.40.2. Predicted Bridge RNA from 3 IS110 group Members. Top of the figure shows a map of the IS as a yellow horizontal box containing a purple arrow representing the transposase gene and its direction of expression. The predicted secondary structure is shown below within the blue dotted line which also indicates its location on the IS, its polarity (5’ and 3’ ends), the IS name and length in nucleotides. A code showing the meaning of the symbols is included on the right. The structure shows the left and right target guide sequences (LTG and RTG) as green ellipses and the left and right donor sequences (which interact with the RE-LE junction; LDG and RDG) as brown ellipses. These interactions are indicated in the box on the right with the target and donor sequences appropriately color coded. For ISPpu10 and ISAar29, the bridge RNA sequence is included below with LTG, RTG, LDT and RDT sequences appropriately color coded in bold underlined and boxed and the blue lines indicating the orientation. The interaction of these sequences with the target and donor DNA is presented at the bottom with the complementary sequences boxed. The yellow boxes on the left represent the left and right ends of the IS in the donor junction joint, the substrate which undergoes integration.
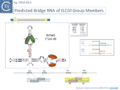
Fig. IS110.40.3 Predicted Bridge RNA from 3 IS110 group Members. Top of the figure shows a map of the IS as a yellow horizontal box containing a purple arrow representing the transposase gene and its direction of expression. The predicted secondary structure is shown below within the blue dotted line which also indicates its location on the IS, its polarity (5’ and 3’ ends), the IS name and length in nucleotides. A code showing the meaning of the symbols is included on the right. The structure shows the left and right target guide sequences (LTG and RTG) as green ellipses and the left and right donor sequences (which interact with the RE-LE junction; LDG and RDG) as brown ellipses. These interactions are indicated in the box on the right with the target and donor sequences appropriately color coded. For ISPpu10 and ISAar29, the bridge RNA sequence is included below with LTG, RTG, LDT and RDT sequences appropriately color coded in bold underlined and boxed and the blue lines indicating the orientation. The interaction of these sequences with the target and donor DNA is presented at the bottom with the complementary sequences boxed. The yellow boxes on the left represent the left and right ends of the IS in the donor junction joint, the substrate which undergoes integration.


RNA from IS1111 Group Members.
Following the proposal that IS1111 group members might use an RNA in the downstream NCR for targeting and integration [30] (Fig. IS110.27A), the Hall group chose the IS1111 group member ISEc11 as a model but also investigated other IS1111 members, ISKpn4, ISPst6 and ISPs25 (which all target one end of certain attC integron cassette sites, ISPa11 which targets REP sequences), ISXne4, and an IS110 member (ISEc21; see above). Their positions in the phylogenetic tree is shown in Fig. IS110.3A.
ISEc11, A Model IS1111 Group Member and Some Others.
ISEc11 (Fig. IS110.41a) was isolated originally from an enteroinvasive E. coli (EIEC) strain and is located both on the chromosome and on a large (260-kb) F-like virulence plasmid (pINV) [75]. Southern hybridization showed that it was present in 9 EIEC strains with differences in the number and the relative location of the chromosomal copies: five East African EIEC strains carry 4 ISEc11 copies in the same position, while the in the remaining four the number varies from 0 to 4. Abutted IS ends, presumably circular transposition intermediates, were detected by PCR. They shared a potential target target sequence, 5’-GTNAAAANANTG-3’, and were all inserted in the same orientation. It was proposed that insertion generated a 4bp DR (5’-AAAT-3’).
Functional Analysis
Using a system similar to that used in analysing ISEc21 (Fig. IS110.10) with a target plasmid into which a specific target sequence is inserted and a donor plasmid carrying either a full ISEc11 copy (Fig. IS110.10, A), a copy deleted for the NCR (ΔNCR; Fig. IS110.10, B), or a with an additional plasmid which provides the NCR expressed in trans (Fig. IS110.10, C), it was demonstrated that the downstream NCR was necessary for transposition and could be supplied in trans from another plasmid. Moreover, in the sequence of the circle junction Prosseda et al [75] proposed a 4bp target DR. This has now been included within LE where it would contribute to the -10 promoter component. PCR was used to identify the IS circle junction (Fig. IS110.41, d) and determine its sequence, revealing the formation of the probable junction promoter. Definition of the target sequence and its use in the target plasmid (Fig. IS110.10) confirmed the expected ISEc11 LE and RE flanks in the insertion products (Fig. IS110.41, e) while mutation of the flanking sequences (Fig. IS110.41, f) inhibited both circle formation and integration.

Identification of IS1111 Group ncrRNA
Like that of IS621, an RNA, ncrRNA, was found to copurify with the ISEc11 transposase and its presence increased transposase yield. RNA seq revealed a peak located within the NCR located downstream of the transposase, tnpEc11, gene (Fig. IS110.41, a). This yielded two principal species of ~80 and 150 nt (82-164 and 82-227; Fig. IS110.41, a) although the RNA peak was somewhat disperse. Similar results identifying a long and shorter sRNA were obtained with 5 additional IS1111 group members ISKpn4 (Fig. IS110.42A), ISPa11 (Fig. IS110.35B), ISPst6 (Fig. IS110.42D), ISPa25 (Fig. IS110.42E) and ISXne4 (Fig. IS110.42F). While ISPst6 is very similar to ISKpn4 (Fig. IS110.42D and Fig. IS110.42E), has identical IRst sequences and a Tnp 86% identical and 92% similar to TnpISKpn4, ISPa25 is more distant: TnpISPa25 and TnpISKpn4 and are 46% identical and 60% similar (Fig. IS110.42E). ISKpn4, ISPst6 and ISPa25 fall into the same IS clade (Fig. IS110.3A) and Interestingly the RTG and LTG are nearly identical and identically spaced (Fig. IS110.42E) reflecting their similar target sites.


Additionally, Siddiquee et al., [28] identified the equivalent of LTG and RTG in the smaller, majority, RNA from all five IS1111 group IS (Fig. IS110.41; Fig. IS110.42A and Fig. IS110.42B), but the short RNA sequence did not include the donor LDG and RDG sequences. It was noted that the order of LTG and RTG within the IS1111 IS NCR RNA was inverted compared to that found for the IS110 group, ISEc21 (Fig. IS110.42A, b), an observation also made by Durrant et al [18]; Fig. IS110.42C; Fig. IS110.43A and 43B). Since the short RNA would have affinity for the target site but not the donor site, it was called RNA seek. However, the longer RNA (not shown) also includes sequences resembling LTD and RTD.
This is illustrated in the case of ISPa11 analysed by both Siddiquee et al [28] and Durrant et al [18] but can also be seen in the other IS. Inspection of the short RNA sequence of Siddiquee et al [28](Fig. IS110. 42B, b) shows that it terminates within a potential LDG signal. Extending this RNA sequence uncovers not only an LDG but a corresponding RDG which would be present in the long RNA species (Fig. IS110.42B, b). Again, the LDG and RDG are inverted with respect to the IS110 group members. These sequences were those predicted by Durrant et al [18] (Fig. IS110.42C). A similar arrangement was also exhibited by two additional IS1111 group members ISCARN28 and ISAzs32 [18]; Fig. IS110.43A and 43B).
Other IS1111 Group Members.
As in the case of the IS110 group, Durrant et al [18] also undertook a short survey of members of the IS1111 group to identify RNA with similar structure to the IS621 bridge RNA. In addition to those shown in Fig. IS110.37C and Fig. IS110.38, a bridge RNA was predicted in 93% of IS1111 group members in the library using the RNA covariance models. These were largely located in the right end (see also Fig. IS110.6A).


Programming ISEc11 Integration.
Siddiquee et al.,[28] tested whether, like the IS110 member Bridge RNAs (Fig. IS110.33 and Fig. IS110.37; [18], the IS1111 group Seek RNA can be reprogrammed to recognize both alternative target sites. This was explored using ISEc11 in the mCherry assay system (Fig. IS110.39). Transposition was measured by flow cytometry as the percentage of mCherry expressing cells in the population. Two modified long seek RNAs together with the corresponding modified LE and RE flank sequences in the donor gave robust transposition (Fig. IS110.44, e and f) although their target activities were not tested with wildtype seek RNA. It is interesting to note that the short wildtype seek RNA was significantly more efficient in promoting transposition than the long wildtype seek RNA (compare Fig. IS110.44, c and d).

Use in Genome Modification
Clearly, the use of the mCherry system demonstrates that the IS110 family is capable of delivering a genetic cargo and that TnpISEc11 can be supplied in trans. Siddiquee et al., [28] extended these observations to demonstrate that the ~750bp chloramphenicol acetyltransferase gene (CAT) can also be inserted either upstream or downstream of the tnpISEc11 gene and that the ISEc11 derivative remains transpositionally active. Additionally, Durrant et al [18] designed a GFP reporter system for the IS110 member IS621 which allowed them to demonstrate the capacity of this system to generate deletion and inversion events when donor and target are located on the same DNA molecule. The system was designed such that recombination brought the GFP gene under control of a neighboring adjacent promoter. As might be expected from other systems, such as transposon Tn3 family resolution, deletion occurs when the target and donor sites are present in the same orientation where inversion occurs when they are inverted with respect to one another.
Structural Analysis: the Synaptic Complex Involved in IS621 Circle Integration
Cryo-EM was used to explored the IS621 insertion mechanism in detail [35]. It revealed the organization of the IS621 synaptic integration complex in three different stages of the recombination pathway involved in IS insertion. The complex was assembled using full length (177nt) purified bridge RNA (b-RNA) obtained by in vitro transcription from a T7 promoter (see Fig. IS110.30A), the double stranded RE-LE IS circle junction DNA (j-DNA or d-DNA; 44bp), the double stranded target DNA (t-DNA; 38bp) and purified transposase, TnpIS621, obtained using a standard expression vector. This complex was unstable but could be stabilised by introducing 6 consecutive mismatches in the top strands of d-DNA and t-DNA (positions 2–7; Fig. IS110.45A, top) in TBL and DBL. The structure was solved at 2.5 Å resolution.
It was composed of: 4 TnpIS621 monomers (A-D) (Fig. IS110.45A, bottom left), both TBL and DBL segments of the b-RNA and both t- and d-DNA. The 5’ b-RNA stem loop (Fig. IS110.32) was not visible, suggesting flexibility, its deletion reduced complex stability implying that it may enhance b-RNA/TnpIS621 Interactions. It was also suggested that that two different b-RNA molecules may contribute the TBL and DBL, respectively.


In addition to revealing a composite active site which positions the catalytic serine (Tnp) residues adjacent to the recombination sites in both target and donor DNA. Comparison of the three structures identified showed: strand cleavage of target and donor DNA at the composite active sites to generate 5′-phosphoserine covalent intermediates as found in other recombination systems such as Tn3 family transposon resolution and IS607 transposition; creation of a Holliday junction intermediate by strand exchange and rejoining using a 3’OH generated resulting from formation of the 5′-phosphoserine covalent intermediates; and resolution by second strand cleavage
Synaptic Complex Assembly
The synaptic complex is assembled from the two dimeric TnpIS621 complexes: monomers A and B form a dimer which interacts with TBL and t-DNA while C and D constitute a dimer which interacts with the DBL and d-DNA (shown schematically in Fig. IS110.46). The two dimers contact each other via their RuvC domains. The TnpIS621 monomer is folded into three domains (Fig. IS110.46 right): a coiled-coil domain, CC, containing two α-helices; a “transposase” domain, Tnp, including the active site serine 241; and a RuvC domain carrying the DEDD motif. Protomer dimerization between TnpIS621.A and TnpIS621.B and between TnpIS621.C and TnpIS621.D is mediated by the CC domain (Fig. IS110.46 left). Similar protein structural models were predicted for both IS110 (TnpISEc21) and IS1111 (TnpISEc11) family members [28] using AlphaFold. As might be expected, TBL and t-DNA and DBL and d-DNA are base paired (Fig. IS110.43A, bottom right; Fig. IS110.43B; Fig. IS110.44) and t- and b-DNA are bent into an X configuration. Both t- and d-DNA are cleaved bordering the CT core sequences (C8–T9; Fig. IS110.43B, Fig. IS110.44) using the conserved serine (S241; Fig. IS110.8.B) as the nucleophile and forming a covalent 5’-phosphoserine bond with T10 (Fig. IS110.44). Extra-helical bases A43 and A67 in TBL and A116 and A150 in DBL together with syn conformation G nucleotides G48 and G72 in TBL and G121 and G155 in DBL (Fig. IS110.44 middle and left) are highly conserved in IS110 family members and are recognized in the same way by the Tnp domain by all 4 TnpIS621 monomers.
Opening of the t-(target) and d-(donor) DNA Duplexes
The structure also explains how the t-(target) and d-(donor) DNA duplexes are destabilized to facilitate their recognition by b-RNA: clustered tyrosine and methionine residues within the Tnp domains wedge between a number of complementary nucleotides in both duplexes (Fig. IS110.44 middle) and mutation of these amino acids reduces recombination significantly.


Composite Active Sites.
The TnpIS621.B and TnpIS621.D loops carrying S241 interact with those carrying D102 (Fig. IS110.47 right) in TnpIS621.C and TnpIS621.A to form a composite active site between the A/B and the C/D dimer (Fig. IS110.43 left). On the other hand, the S241 loops of TnpIS621.A and TnpIS621.C are disordered and the TnpIS621.B and TnpIS621.D D102 loops have a different conformation to those in TnpIS621.A and TnpIS621.C which form part of the active site.
The TnpIS621 RuvC domain is therefore unusual since it does not act independently, as do other RuvC domains (e.g. IS200/IS605 family TnpB), but functions together with the Tnp domain (i.e. S241) in the composite active site. It was suggested that this arrangement may prevent adventitious DNA cleavage occurring before synaptic complex assembly, a characteristic of a number of other systems such as phage Mu (e.g. Williams et al [76]) and Tn5/IS50 (Protein structure and the transpososome [77] ). The RuvC domains also play a central role in synaptic complex formation since the two dimers contact each other through RuvC–RuvC interactions.

"Hand shaking": additional secondary base pairing which facilitates first strand exchange.
This synaptic complex is, however, trapped in the prestrand-transfer step because of the mismatched base pairs in both t-DNA and d-DNA introduced to stabilize the complex (Fig. IS110.45A top; see also Fig.IS110.30A).
Close examination of the covariation signals obtained with a large number of IS621-related IS (e.g. Fig.IS110.30A) revealed weak additional signals which implied base-pairing potential of nt 6 and 7 of target DNA with the long-distant donor RDG (nt 166) and of nt 6 and 7 of donor DNA with the long-distant donor RTG (nt 81). This was called Handshake base pairing and the sequences were named Handshake guides (HSG). It was noted that they play a role in the first strand exchange reaction. Exchange in the wildtype situation increases the potential base pairing (Fig. IS110.48 and Fig.IS110.49 A). Measurement of full recombinants in vitro with wildtype b-RNA (Fig. IS110.42A) showed that in addition to robust recombination products, a significant proportion of cleavage products of the t- and d-DNA had occurred. A series of experiments were designed to examine the effects of Handshake nucleotide complementarity on strand exchange using modified b-RNA. Generating total complementarity of RTG-target and RDG-donor duplex HSG (i.e. prior to strand transfer; Pre-HSG; Fig. IS110.49 B) strongly favoured t- and d-DNA cleavage but eliminated detectable recombination in vitro, whereas modifying the HSG sequences to generate perfect complementarity after strand transfer (Post-HSG; Fig. IS110.49 C) strongly favored DNA recombination in vitro at the expense of d-DNA cleavage products. The “handshake” dinucleotide therefore clearly strongly influences the outcome of the reaction.

To investigate the steps in the reaction, in addition to the synaptic complex assembled with the 7 mismatches in t- and d-DNA (Fig. IS100.48 left, top and bottom; Fig. IS110.50A), structures were resolved using both Pre-HSG b-RNA where recombination is blocked at the pre-strand transfer step (Fig. IS110.49 B; Fig. IS110.50B), and Post-HSG b-RNA where recombination is robust but cleavage is reduced (Fig. IS110.49 C; Fig. IS110.50C).


The cryo-EM structure of the post-HSB b-RNA (Fig. IS110.50C) synaptic complex reveal two states: a post 1st strand exchange trapping the Holliday Junction intermediate and a post strand exchange with HJ resolution. In one (Fig. IS110.51 left) the 1st strand transfer of the donor (at DBL) junction appears complete while that of the target (at TBL) is only partially rejoined while in the other (Fig. IS110.51 right) species, the 2nd strand of the donor (at DBL) junction has been cleaved and the 2nd target strand (at TBL) is only partially cleaved.

These snapshots provide a detailed overall picture of the way in which the IS LE-RE junctions formed to generate circular transposition intermediates interact with their bridge RNAs as the donor DNA and how the bridge RNA interact with the target. Bridge RNA clearly orchestrates the apposition of IS junction and target DNA generating a defined structure
Questions to be Answered
Mechanism Involved in the First Transposition Step: Circle Formation?
However, there are a number of important questions remaining not least, the mechanism by which the IS circular intermediate is generated. Formation using site-specific recombination would be expected to regenerate the original target site. Siddiquee et al., [28] were unable to detect such uninterrupted sequences with the PCR assay used to detect ISEc11 circle intermediates. This suggests that excision does not occur using a classical double-strand site-specific recombination mechanism. It remains possible that excision occurs using a single-strand recombination accompanied by a replicative step in a copy-out-paste-in mechanism similar to that used by the IS3 family and other IS families. None of the recent studies have addressed this step of the transposition process.
Long and short: How is IS1111 NCR RNA Generated: Processing?
It should be noted that the failure of Siddiquee et al.,[28] to identify full length Bridge RNAs may simply be due to the way in which the RNA species were generated: Durrant et al.,[18] generated Bridge RNA directly by transcription of a cloned RE-LE junction whereas Siddiquee et al., [28] defined the RNA from co-purification with the transposase. This raises the interesting question for both the IS110 and IS1111 groups of how the RNA which co-purifies with the transposase is produced. In the case of ISPa11, no specific NCR promoter was identified by inspection and it was suggested that the small RNA is generated from a longer transcript [28], possibly from the transposase mRNA.
This has been demonstrated in the case of the guide RNA from IS200/IS605 family members where the TnpB guide endonuclease is involved (see: IS200/IS605 family: RNA Nomenclature, Processing, Structure, Diversity and mode of function). It probably also occurs in generating the upstream RNA virulence repressor of IS200, arc200, from the tnpA mRNA (Fig. IS200.74) [78].
It would be interesting to determine whether the presence of the shorter seek RNA requires transposase catalytic activity and whether “full length” Bridge RNA can be processed by the transposase.
Is there a Biological Significance to the High Level of the shorter Seek RNA species?
The observation that the shorter sRNA species is the major RNA product which purifies with the transposase of both IS1111 group members (ISEc21, ISKpn4 and ISPa11; Fig. IS110.41, 42A, 42B) and IS110 group member, ISEc21; Fig. IS110.38) and that the longer RNA is significantly less abundant is intriguing. A trivial explanation would be that it has a higher affinity for the transposase than bridge RNA. The short RNA was not identified by Durrant et al., [18] presumably because their approach would not necessarily have detected such species. One notion would be that rather than a degradation product, the small seek RNA is in some way involved in IS circularization for example, by recognizing the two flanking segments of the target sequence. Another possibility is that it acts in trans to “prime” suitable targets in the host genome for recognition by the IS circle.
Additionally, is the long RNA carrying the LDG and RDG sequences required for integration or is it involved in assuring the formation of the IS circle? Do both short and long RNA have similar affinity for the transposase?
Possibility of regulation by arc9-like anti RNA?
An important consideration is the regulatory role and presence of anti-RNA such as ars9 found in ISPpu9 [32] in other IS110 family members. This, to our knowledge, has not received further attention. It should be noted that an upstream NCR (UTR) in the unrelated IS200 (see: IS200 Regulation and Salmonella Pathogenicity) is processed to become a repressor of transcription of certain Salmonella host virulence-associated genes [78]. Expression of an anti-RNA, art200, leads to RNA-anti-RNA interactions between complementary secondary structures in the NTR and degradation of transposase mRNA (including the 5’ processed NCR region). It therefore seems possible that, because of their similar organisation, IS110 family members might also be regulated in this way.
Acknowledgements
We would like to thank Anna Karls (University of Georgia, Athens, Georgia, USA) for early discussions concerning IS492 transposition, Matthew Durrant and Nicholas Perry (Arc Institute and UC Berkley, Berkley, USA) for providing information and figures concerning the structure and activities of Bridge RNA and for the phylogenetic tree, and Fernando Rojo (Centro Nacional de Biotecnología, CSIC, Madrid, Spain) for discussions concerning ISPpu9.
Bibliography
- ↑ Chater KF, Bruton CJ, Foster SG, Tobek I . Physical and genetic analysis of IS110, a transposable element of Streptomyces coelicolor A3(2). - Mol Gen Genet: 1985, 200(2);235-9 [PubMed:2993819] [DOI]
- ↑ 2.0 2.1 Siguier P, Perochon J, Lestrade L, Mahillon J, Chandler M . ISfinder: the reference centre for bacterial insertion sequences. - Nucleic Acids Res: 2006 Jan 1, 34(Database issue);D32-6 [PubMed:16381877] [DOI]
- ↑ Hoover TA, Vodkin MH, Williams JC . A Coxiella burnetti repeated DNA element resembling a bacterial insertion sequence. - J Bacteriol: 1992 Sep, 174(17);5540-8 [PubMed:1324903] [DOI]
- ↑ Vary PH, Andersen PR, Green E, Hermon-Taylor J, McFadden JJ . Use of highly specific DNA probes and the polymerase chain reaction to detect Mycobacterium paratuberculosis in Johne's disease. - J Clin Microbiol: 1990 May, 28(5);933-7 [PubMed:2351737] [DOI]
- ↑ Whipple D, Kapke P, Vary C . Identification of restriction fragment length polymorphisms in DNA from Mycobacterium paratuberculosis. - J Clin Microbiol: 1990 Nov, 28(11);2561-4 [PubMed:1979332] [DOI]
- ↑ Ritacco V, Kremer K, van der Laan T, Pijnenburg JE, de Haas PE, van Soolingen D . Use of IS901 and IS1245 in RFLP typing of Mycobacterium avium complex: relatedness among serovar reference strains, human and animal isolates. - Int J Tuberc Lung Dis: 1998 Mar, 2(3);242-51 [PubMed:9526198]
- ↑ Kunze ZM, Wall S, Appelberg R, Silva MT, Portaels F, McFadden JJ . IS901, a new member of a widespread class of atypical insertion sequences, is associated with pathogenicity in Mycobacterium avium. - Mol Microbiol: 1991 Sep, 5(9);2265-72 [PubMed:1685008] [DOI]
- ↑ Ahrens P, Giese SB, Klausen J, Inglis NF . Two markers, IS901-IS902 and p40, identified by PCR and by using monoclonal antibodies in Mycobacterium avium strains. - J Clin Microbiol: 1995 May, 33(5);1049-53 [PubMed:7615703] [DOI]
- ↑ Kunze ZM, Portaels F, McFadden JJ . Biologically distinct subtypes of Mycobacterium avium differ in possession of insertion sequence IS901. - J Clin Microbiol: 1992 Sep, 30(9);2366-72 [PubMed:1328288] [DOI]
- ↑ Collins DM, Cavaignac S, de Lisle GW . Use of four DNA insertion sequences to characterize strains of the Mycobacterium avium complex isolated from animals. - Mol Cell Probes: 1997 Oct, 11(5);373-80 [PubMed:9375297] [DOI]
- ↑ Denison AM, Thompson HA, Massung RF . IS1111 insertion sequences of Coxiella burnetii: characterization and use for repetitive element PCR-based differentiation of Coxiella burnetii isolates. - BMC Microbiol: 2007 Oct 18, 7;91 [PubMed:17949485] [DOI]
- ↑ Seshadri R, Paulsen IT, Eisen JA, Read TD, Nelson KE, Nelson WC, Ward NL, Tettelin H, Davidsen TM, Beanan MJ, Deboy RT, Daugherty SC, Brinkac LM, Madupu R, Dodson RJ, Khouri HM, Lee KH, Carty HA, Scanlan D, Heinzen RA, Thompson HA, Samuel JE, Fraser CM, Heidelberg JF . Complete genome sequence of the Q-fever pathogen Coxiella burnetii. - Proc Natl Acad Sci U S A: 2003 Apr 29, 100(9);5455-60 [PubMed:12704232] [DOI]
- ↑ Rozental T, Mascarenhas LF, Rozenbaum R, Gomes R, Mattos GS, Magno CC, Almeida DN, Rossi MI, Favacho AR, de Lemos ER . Coxiella burnetii, the agent of Q fever in Brazil: its hidden role in seronegative arthritis and the importance of molecular diagnosis based on the repetitive element IS1111 associated with the transposase gene. - Mem Inst Oswaldo Cruz: 2012 Aug, 107(5);695-7 [PubMed:22850965] [DOI]
- ↑ Bartlett DH, Wright ME, Silverman M . Variable expression of extracellular polysaccharide in the marine bacterium Pseudomonas atlantica is controlled by genome rearrangement. - Proc Natl Acad Sci U S A: 1988 Jun, 85(11);3923-7 [PubMed:16593937] [DOI]
- ↑ Bartlett DH, Silverman M . Nucleotide sequence of IS492, a novel insertion sequence causing variation in extracellular polysaccharide production in the marine bacterium Pseudomonas atlantica. - J Bacteriol: 1989 Mar, 171(3);1763-6 [PubMed:2537827] [DOI]
- ↑ Partridge SR, Hall RM . The IS1111 family members IS4321 and IS5075 have subterminal inverted repeats and target the terminal inverted repeats of Tn21 family transposons. - J Bacteriol: 2003 Nov, 185(21);6371-84 [PubMed:14563872] [DOI]
- ↑ 17.0 17.1 17.2 17.3 17.4 17.5 17.6 Lauf U, Müller C, Herrmann H . Identification and characterisation of IS1383, a new insertion sequence isolated from Pseudomonas putida strain H. - FEMS Microbiol Lett: 1999 Jan 15, 170(2);407-12 [PubMed:9933934] [DOI]
- ↑ 18.00 18.01 18.02 18.03 18.04 18.05 18.06 18.07 18.08 18.09 18.10 18.11 18.12 18.13 18.14 18.15 18.16 18.17 18.18 18.19 18.20 18.21 18.22 18.23 18.24 18.25 18.26 18.27 18.28 18.29 18.30 18.31 18.32 Durrant MG, Perry NT, Pai JJ, Jangid AR, Athukoralage JS, Hiraizumi M, McSpedon JP, Pawluk A, Nishimasu H, Konermann S, Hsu PD . Bridge RNAs direct modular and programmable recombination of target and donor DNA. - bioRxiv: 2024 Jan 26; [PubMed:38328150] [DOI]
- ↑ 19.00 19.01 19.02 19.03 19.04 19.05 19.06 19.07 19.08 19.09 19.10 Durrant MG, Perry NT, Pai JJ, Jangid AR, Athukoralage JS, Hiraizumi M, McSpedon JP, Pawluk A, Nishimasu H, Konermann S, Hsu PD . Bridge RNAs direct programmable recombination of target and donor DNA. - Nature: 2024 Jun, 630(8018);984-993 [PubMed:38926615] [DOI]
- ↑ 20.0 20.1 20.2 20.3 20.4 20.5 20.6 20.7 Choi S, Ohta S, Ohtsubo E . A novel IS element, IS621, of the IS110/IS492 family transposes to a specific site in repetitive extragenic palindromic sequences in Escherichia coli. - J Bacteriol: 2003 Aug, 185(16);4891-900 [PubMed:12897009] [DOI]
- ↑ 21.0 21.1 21.2 21.3 Tobiason DM, Buchner JM, Thiel WH, Gernert KM, Karls AC . Conserved amino acid motifs from the novel Piv/MooV family of transposases and site-specific recombinases are required for catalysis of DNA inversion by Piv. - Mol Microbiol: 2001 Feb, 39(3);641-51 [PubMed:11169105] [DOI]
- ↑ 22.0 22.1 Buchner JM, Robertson AE, Poynter DJ, Denniston SS, Karls AC . Piv site-specific invertase requires a DEDD motif analogous to the catalytic center of the RuvC Holliday junction resolvases. - J Bacteriol: 2005 May, 187(10);3431-7 [PubMed:15866929] [DOI]
- ↑ Fulks KA, Marrs CF, Stevens SP, Green MR . Sequence analysis of the inversion region containing the pilin genes of Moraxella bovis. - J Bacteriol: 1990 Jan, 172(1);310-6 [PubMed:2403542] [DOI]
- ↑ Rozsa FW, Meyer TF, Fussenegger M . Inversion of Moraxella lacunata type 4 pilin gene sequences by a Neisseria gonorrhoeae site-specific recombinase. - J Bacteriol: 1997 Apr, 179(7);2382-8 [PubMed:9079926] [DOI]
- ↑ 25.0 25.1 25.2 25.3 25.4 25.5 Choi S, Ohta S, Ohtsubo E . A novel IS element, IS621, of the IS110/IS492 family transposes to a specific site in repetitive extragenic palindromic sequences in Escherichia coli. - J Bacteriol: 2003 Aug, 185(16);4891-900 [PubMed:12897009] [DOI]
- ↑ Lenich AG, Glasgow AC . Amino acid sequence homology between Piv, an essential protein in site-specific DNA inversion in Moraxella lacunata, and transposases of an unusual family of insertion elements. - J Bacteriol: 1994 Jul, 176(13);4160-4 [PubMed:8021196] [DOI]
- ↑ 27.0 27.1 27.2 27.3 Skaar EP, Lecuyer B, Lenich AG, Lazio MP, Perkins-Balding D, Seifert HS, Karls AC . Analysis of the Piv recombinase-related gene family of Neisseria gonorrhoeae. - J Bacteriol: 2005 Feb, 187(4);1276-86 [PubMed:15687191] [DOI]
- ↑ 28.00 28.01 28.02 28.03 28.04 28.05 28.06 28.07 28.08 28.09 28.10 28.11 28.12 28.13 28.14 28.15 28.16 28.17 28.18 28.19 28.20 28.21 28.22 28.23 28.24 28.25 28.26 28.27 28.28 28.29 Siddiquee R, Pong CH, Hall RM, Ataide SF . A programmable seekRNA guides target selection by IS1111 and IS110 type insertion sequences. - Nat Commun: 2024 Jun 19, 15(1);5235 [PubMed:38898016] [DOI]
- ↑ Tetu SG, Holmes AJ . A family of insertion sequences that impacts integrons by specific targeting of gene cassette recombination sites, the IS1111-attC Group. - J Bacteriol: 2008 Jul, 190(14);4959-70 [PubMed:18487340] [DOI]
- ↑ 30.0 30.1 30.2 30.3 Post V, Hall RM . Insertion sequences in the IS1111 family that target the attC recombination sites of integron-associated gene cassettes. - FEMS Microbiol Lett: 2009 Jan, 290(2);182-7 [PubMed:19025573] [DOI]
- ↑ 31.0 31.1 31.2 31.3 31.4 Partridge SR, Hall RM . The IS1111 family members IS4321 and IS5075 have subterminal inverted repeats and target the terminal inverted repeats of Tn21 family transposons. - J Bacteriol: 2003 Nov, 185(21);6371-84 [PubMed:14563872] [DOI]
- ↑ 32.00 32.01 32.02 32.03 32.04 32.05 32.06 32.07 32.08 32.09 32.10 32.11 Gómez-García G, Ruiz-Enamorado A, Yuste L, Rojo F, Moreno R . Expression of the ISPpu9 transposase of Pseudomonas putida KT2440 is regulated by two small RNAs and the secondary structure of the mRNA 5'-untranslated region. - Nucleic Acids Res: 2021 Sep 20, 49(16);9211-9228 [PubMed:34379788] [DOI]
- ↑ 33.00 33.01 33.02 33.03 33.04 33.05 33.06 33.07 33.08 33.09 33.10 33.11 33.12 33.13 33.14 33.15 33.16 33.17 Elena Parés-Guillén, Luis Yuste, Fernando Rojo, Renata Moreno. The ISPpu9 insertion sequence of Pseudomonas putida KT2440 generates various circular intermediates enabling modular transposition. doi: https://doi.org/10.1101/2025.01.17.633520
- ↑ 34.0 34.1 Buchner JM, Robertson AE, Poynter DJ, Denniston SS, Karls AC . Piv site-specific invertase requires a DEDD motif analogous to the catalytic center of the RuvC Holliday junction resolvases. - J Bacteriol: 2005 May, 187(10);3431-7 [PubMed:15866929] [DOI]
- ↑ 35.0 35.1 35.2 35.3 35.4 35.5 Hiraizumi M, Perry NT, Durrant MG, Soma T, Nagahata N, Okazaki S, Athukoralage JS, Isayama Y, Pai JJ, Pawluk A, Konermann S, Yamashita K, Hsu PD, Nishimasu H . Structural mechanism of bridge RNA-guided recombination. - Nature: 2024 Jun, 630(8018);994-1002 [PubMed:38926616] [DOI]
- ↑ Tobiason DM, Lenich AG, Glasgow AC . Multiple DNA binding activities of the novel site-specific recombinase, Piv, from Moraxella lacunata. - J Biol Chem: 1999 Apr 2, 274(14);9698-706 [PubMed:10092658] [DOI]
- ↑ Duckett DR, Murchie AI, Diekmann S, von Kitzing E, Kemper B, Lilley DM . The structure of the Holliday junction, and its resolution. - Cell: 1988 Oct 7, 55(1);79-89 [PubMed:3167979] [DOI]
- ↑ Ariyoshi M, Vassylyev DG, Iwasaki H, Nakamura H, Shinagawa H, Morikawa K . Atomic structure of the RuvC resolvase: a holliday junction-specific endonuclease from E. coli. - Cell: 1994 Sep 23, 78(6);1063-72 [PubMed:7923356] [DOI]
- ↑ Tizard ML, Moss MT, Sanderson JD, Austen BM, Hermon-Taylor J . p43, the protein product of the atypical insertion sequence IS900, is expressed in Mycobacterium paratuberculosis. - J Gen Microbiol: 1992 Aug, 138 Pt 8;1729-36 [PubMed:1326596] [DOI]
- ↑ 40.0 40.1 40.2 40.3 40.4 Henderson DJ, Lydiate DJ, Hopwood DA . Structural and functional analysis of the mini-circle, a transposable element of Streptomyces coelicolor A3(2). - Mol Microbiol: 1989 Oct, 3(10);1307-18 [PubMed:2575701] [DOI]
- ↑ 41.0 41.1 Henderson DJ, Brolle DF, Kieser T, Melton RE, Hopwood DA . Transposition of IS117 (the Streptomyces coelicolor A 3 (2) mini-circle) to and from a cloned target site and into secondary chromosomal sites. - Mol Gen Genet: 1990 Oct, 224(1);65-71 [PubMed:2177525] [DOI]
- ↑ 42.0 42.1 Smokvina T, Hopwood DA . Analysis of secondary integration sites for IS117 in Streptomyces lividans and their role in the generation of chromosomal deletions. - Mol Gen Genet: 1993 May, 239(1-2);90-6 [PubMed:8389980] [DOI]
- ↑ 43.0 43.1 Leskiw BK, Mevarech M, Barritt LS, Jensen SE, Henderson DJ, Hopwood DA, Bruton CJ, Chater KF . Discovery of an insertion sequence, IS116, from Streptomyces clavuligerus and its relatedness to other transposable elements from actinomycetes. - J Gen Microbiol: 1990 Jul, 136(7);1251-8 [PubMed:1700062] [DOI]
- ↑ 44.0 44.1 44.2 Perkins-Balding D, Duval-Valentin G, Glasgow AC . Excision of IS492 requires flanking target sequences and results in circle formation in Pseudoalteromonas atlantica. - J Bacteriol: 1999 Aug, 181(16);4937-48 [PubMed:10438765] [DOI]
- ↑ Higgins BP, Popkowski AC, Caruana PR, Karls AC . Site-specific insertion of IS492 in Pseudoalteromonas atlantica. - J Bacteriol: 2009 Oct, 191(20);6408-14 [PubMed:19684137] [DOI]
- ↑ 46.0 46.1 46.2 46.3 Müller C, Lauf U, Hermann H . The inverted repeats of IS1384, a newly described insertion sequence from Pseudomonas putida strain H, represent the specific target for integration of IS1383. - Mol Genet Genomics: 2001 Aug, 265(6);1004-10 [PubMed:11523772] [DOI]
- ↑ 47.0 47.1 47.2 Prosseda G, Latella MC, Casalino M, Nicoletti M, Michienzi S, Colonna B . Plasticity of the P junc promoter of ISEc11, a new insertion sequence of the IS1111 family. - J Bacteriol: 2006 Jul, 188(13);4681-9 [PubMed:16788177] [DOI]
- ↑ Smokvina T, Henderson DJ, Melton RE, Brolle DF, Kieser T, Hopwood DA . Transposition of IS117, the 2.5 kb Streptomyces coelicolor A3(2) 'minicircle': roles of open reading frames and origin of tandem insertions. - Mol Microbiol: 1994 May, 12(3);459-68 [PubMed:8065263] [DOI]
- ↑ Higgins BP, Carpenter CD, Karls AC . Chromosomal context directs high-frequency precise excision of IS492 in Pseudoalteromonas atlantica. - Proc Natl Acad Sci U S A: 2007 Feb 6, 104(6);1901-6 [PubMed:17264213] [DOI]
- ↑ 50.0 50.1 Tobes R, Pareja E . Bacterial repetitive extragenic palindromic sequences are DNA targets for Insertion Sequence elements. - BMC Genomics: 2006 Mar 24, 7;62 [PubMed:16563168] [DOI]
- ↑ Fogg JM, Schofield MJ, White MF, Lilley DM . Sequence and functional-group specificity for cleavage of DNA junctions by RuvC of Escherichia coli. - Biochemistry: 1999 Aug 31, 38(35);11349-58 [PubMed:10471285] [DOI]
- ↑ He S, Corneloup A, Guynet C, Lavatine L, Caumont-Sarcos A, Siguier P, Marty B, Dyda F, Chandler M, Ton Hoang B . The IS200/IS605 Family and "Peel and Paste" Single-strand Transposition Mechanism. - Microbiol Spectr: 2015 Aug, 3(4); [PubMed:26350330] [DOI]
- ↑ 53.0 53.1 Bachellier S, Clément JM, Hofnung M, Gilson E . Bacterial interspersed mosaic elements (BIMEs) are a major source of sequence polymorphism in Escherichia coli intergenic regions including specific associations with a new insertion sequence. - Genetics: 1997 Mar, 145(3);551-62 [PubMed:9055066] [DOI]
- ↑ 54.0 54.1 Bachellier S, Perrin D, Hofnung M, Gilson E . Bacterial interspersed mosaic elements (BIMEs) are present in the genome of Klebsiella. - Mol Microbiol: 1993 Feb, 7(4);537-44 [PubMed:8459773] [DOI]
- ↑ 55.0 55.1 Bachellier S, Saurin W, Perrin D, Hofnung M, Gilson E . Structural and functional diversity among bacterial interspersed mosaic elements (BIMEs). - Mol Microbiol: 1994 Apr, 12(1);61-70 [PubMed:8057840] [DOI]
- ↑ Bachellier S, Clément JM, Hofnung M . Short palindromic repetitive DNA elements in enterobacteria: a survey. - Res Microbiol: 1999 Nov-Dec, 150(9-10);627-39 [PubMed:10673002] [DOI]
- ↑ Nunvar J, Huckova T, Licha I . Identification and characterization of repetitive extragenic palindromes (REP)-associated tyrosine transposases: implications for REP evolution and dynamics in bacterial genomes. - BMC Genomics: 2010 Jan 19, 11;44 [PubMed:20085626] [DOI]
- ↑ Nunvar J, Licha I, Schneider B . Evolution of REP diversity: a comparative study. - BMC Genomics: 2013 Jun 10, 14;385 [PubMed:23758774] [DOI]
- ↑ 59.0 59.1 Ramos-González MI, Campos MJ, Ramos JL, Espinosa-Urgel M . Characterization of the Pseudomonas putida mobile genetic element ISPpu10: an occupant of repetitive extragenic palindromic sequences. - J Bacteriol: 2006 Jan, 188(1);37-44 [PubMed:16352819] [DOI]
- ↑ Aranda-Olmedo I, Tobes R, Manzanera M, Ramos JL, Marqués S . Species-specific repetitive extragenic palindromic (REP) sequences in Pseudomonas putida. - Nucleic Acids Res: 2002 Apr 15, 30(8);1826-33 [PubMed:11937637] [DOI]
- ↑ 61.0 61.1 61.2 61.3 Tobes R, Pareja E . Bacterial repetitive extragenic palindromic sequences are DNA targets for Insertion Sequence elements. - BMC Genomics: 2006 Mar 24, 7;62 [PubMed:16563168] [DOI]
- ↑ 62.0 62.1 Tetu SG, Holmes AJ . A family of insertion sequences that impacts integrons by specific targeting of gene cassette recombination sites, the IS1111-attC Group. - J Bacteriol: 2008 Jul, 190(14);4959-70 [PubMed:18487340] [DOI]
- ↑ 63.0 63.1 Mazel D . Integrons: agents of bacterial evolution. - Nat Rev Microbiol: 2006 Aug, 4(8);608-20 [PubMed:16845431] [DOI]
- ↑ Hall RM, Brookes DE, Stokes HW . Site-specific insertion of genes into integrons: role of the 59-base element and determination of the recombination cross-over point. - Mol Microbiol: 1991 Aug, 5(8);1941-59 [PubMed:1662753] [DOI]
- ↑ 65.0 65.1 Bouvier M, Ducos-Galand M, Loot C, Bikard D, Mazel D . Structural features of single-stranded integron cassette attC sites and their role in strand selection. - PLoS Genet: 2009 Sep, 5(9);e1000632 [PubMed:19730680] [DOI]
- ↑ Cambray G, Guerout AM, Mazel D . Integrons. - Annu Rev Genet: 2010, 44;141-66 [PubMed:20707672] [DOI]
- ↑ MacDonald D, Demarre G, Bouvier M, Mazel D, Gopaul DN . Structural basis for broad DNA-specificity in integron recombination. - Nature: 2006 Apr 27, 440(7088);1157-62 [PubMed:16641988] [DOI]
- ↑ Olsen I, Johansen TB, Billman-Jacobe H, Nilsen SF, Djønne B . A novel IS element, ISMpa1, in Mycobacterium avium subsp. paratuberculosis. - Vet Microbiol: 2004 Mar 5, 98(3-4);297-306 [PubMed:15036538] [DOI]
- ↑ Duval-Valentin G, Normand C, Khemici V, Marty B, Chandler M . Transient promoter formation: a new feedback mechanism for regulation of IS911 transposition. - EMBO J: 2001 Oct 15, 20(20);5802-11 [PubMed:11598022] [DOI]
- ↑ Ton-Hoang B, Bétermier M, Polard P, Chandler M . Assembly of a strong promoter following IS911 circularization and the role of circles in transposition. - EMBO J: 1997 Jun 2, 16(11);3357-71 [PubMed:9214651] [DOI]
- ↑ Lyras D, Rood JI . Transposition of Tn4451 and Tn4453 involves a circular intermediate that forms a promoter for the large resolvase, TnpX. - Mol Microbiol: 2000 Nov, 38(3);588-601 [PubMed:11069682] [DOI]
- ↑ Sánchez-Hevia DL, Yuste L, Moreno R, Rojo F . Influence of the Hfq and Crc global regulators on the control of iron homeostasis in Pseudomonas putida. - Environ Microbiol: 2018 Oct, 20(10);3484-3503 [PubMed:29708644] [DOI]
- ↑ Seemayer S, Gruber M, Söding J . CCMpred--fast and precise prediction of protein residue-residue contacts from correlated mutations. - Bioinformatics: 2014 Nov 1, 30(21);3128-30 [PubMed:25064567] [DOI]
- ↑ Perkins-Balding D, Duval-Valentin G, Glasgow AC . Excision of IS492 requires flanking target sequences and results in circle formation in Pseudoalteromonas atlantica. - J Bacteriol: 1999 Aug, 181(16);4937-48 [PubMed:10438765] [DOI]
- ↑ 75.0 75.1 Prosseda G, Latella MC, Casalino M, Nicoletti M, Michienzi S, Colonna B . Plasticity of the P junc promoter of ISEc11, a new insertion sequence of the IS1111 family. - J Bacteriol: 2006 Jul, 188(13);4681-9 [PubMed:16788177] [DOI]
- ↑ Williams TL, Jackson EL, Carritte A, Baker TA . Organization and dynamics of the Mu transpososome: recombination by communication between two active sites. - Genes Dev: 1999 Oct 15, 13(20);2725-37 [PubMed:10541558] [DOI]
- ↑ Naumann TA, Reznikoff WS . Trans catalysis in Tn5 transposition. - Proc Natl Acad Sci U S A: 2000 Aug 1, 97(16);8944-9 [PubMed:10908658] [DOI]
- ↑ 78.0 78.1 Ellis MJ, Trussler RS, Charles O, Haniford DB . A transposon-derived small RNA regulates gene expression in Salmonella Typhimurium. - Nucleic Acids Res: 2017 May 19, 45(9);5470-5486 [PubMed:28335027] [DOI]